
Formwork tie rods are not consumed once. The reusable half of the system is issued to a wall, recovered after striking, inspected, and issued again on the next wall. In between, it sits in a yard on a project that is usually not the one that will use it next.
A site that does not control this cycle is buying the same rods twice — once as capital, and again as a replacement when the "returned" total turns out to be less than issued. The gap shows up at reconciliation, when it is too late to act.
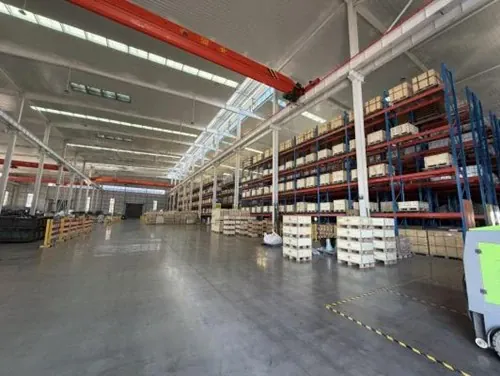
This article is about running that cycle as a managed asset: how to set issue and return control, what to measure, and how to read the loss trend early enough to do something about it.
Issue control: the number that starts everything
Nothing downstream works without a clean issue record. When a wall is issued, the yard should record, against a wall reference:
- The quantity issued, by item and count, in complete sets.
- The wall reference — which wall, which pour, which location.
- The date, because cycle time is the denominator of any reuse calculation.
Most sites record issue informally and return formally, which guarantees a permanent apparent loss. The two must be recorded the same way or neither number is trustworthy. This is the same discipline that separates a real loss figure from a bookkeeping artefact, and it is worth the small extra effort at the point of issue because it is the only point where the count is unambiguous.
Return control: sorted at recovery, not at ordering
Hardware comes back in a mixed state: clean, dirty, deformed, corroded, cut, complete, incomplete. The recovery point is where the decision gets made, and it is much cheaper to make it there than to discover three months later that a third of the stock was unsortable.
At recovery, sort into three states:
- Reissue — complete, within dimensional tolerance, threads serviceable, no deformation. Returns to stock as a set.
- Repair — incomplete but recoverable: missing a nut, a plate with a bent centre, a connector whose thread is galled but serviceable. Held separately so it does not contaminate the reissue count.
- Scrap — cut rods, rods with damaged threads beyond limit, plates beyond deformation limit, anything that has lost its function.
The criterion for each state must be written down. Otherwise the sorting yard applies a different standard each time, and when the loss rate is questioned there is no definition to point at. What defines recoverable versus non-recoverable at the engineering level is in thread damage and repair limits.
Measuring recovery in sets
Recovery rate is normally quoted as a percentage, and the percentage is only meaningful if the unit is stated. Count in complete reusable sets, not in individual pieces.
The reason is simple. A yard holding four external rods, two plates and no nuts has not recovered half a set — it has recovered pieces and has capital tied up in them. Those pieces will go out again only when the missing parts turn up, which may be never. Counting by piece inflates the stock, hides the shortage until it blocks a wall, and makes the recovery figure meaningless as a predictor of what can actually be issued.
A workable measurement, per batch cycle:
| Measure | How it is calculated | What it tells you |
|---|---|---|
| Set recovery rate | Sets recovered complete ÷ sets issued | Real capital return |
| Piece recovery rate | Pieces recovered ÷ pieces issued | Trend indicator only, not a stock figure |
| Repair ratio | Sets in repair ÷ sets recovered | Whether the repair step is working |
| Cycle time | Days from issue to reissue availability | How fast stock turns |
| Loss rate by cause | Scrapped quantity ÷ issued, by reason | Which cause to act on |
The loss-by-cause column is the most useful and the most commonly missing. An aggregate 18% loss tells you nothing actionable. Broken down into "cut on site 7%, thread damage 4%, deformation 3%, corrosion 2%, unaccounted 2%" it tells you exactly which habit to change. Unaccounted loss in particular is worth watching: a figure that stays high usually means the record is incomplete rather than that the stock is unusually careless.
Dimensional inspection of threaded fasteners follows the general principles in ISO 898-1, which sets the mechanical property classes you inspect against; thread tolerance systems are covered in ISO 965-1. Neither standard tells you what counts as recoverable — that criterion is a commercial decision you have to write down, which is the point made earlier in this article.
Reading the loss trend before reconciliation
The value of measurement is that it happens early enough to act. A loss figure computed at project close is a fact. The same figure computed monthly is a control.
Three signals worth watching:
A steady rate is normal operating loss. Nothing is being done wrong; the baseline is simply what the process produces.
A falling rate points at a specific cause and usually starts with handling. Stacking practices that damage threads or deform plates, or storage that allows corrosion to develop on coated surfaces, degrade a batch faster than wear does. The coating choice changes how parts survive storage, covered in coating selection, and the packing detail that prevents transit and storage damage is in export packing and rust prevention.
A sudden jump is almost always a process change: a new pour sequence, a different crew, a changed storage location, or a decision to cut rods on site because the return trip was inconvenient. A sudden jump is good news in the diagnostic sense — it means the cause is identifiable, because something changed.
What makes hardware returnable in the first place
Recovery rate is set long before the wall is struck. Four properties of the hardware decide whether it can come back:
- Thread condition. Threads that gall or deform during assembly come back damaged and go to scrap. Prevention is in thread galling prevention.
- Plate rigidity. Bearing plates that deform under nut torque cannot be reused without losing the flat bearing they exist to provide.
- Coating durability. A coating that fails in storage returns parts that will be rejected on inspection, which is a loss that looks like the supplier's fault and is not.
- Marking. Permanent marking is what lets a sorting yard identify which system a returned part belongs to and whether it is reissuable. Without it, sorting is guesswork and the recovery rate becomes an estimate.
Turning this into a purchase decision
The inventory control described here only matters if it changes something at order stage. It changes three things:
- Whether to buy stock or sets. Recurring work and rental fleets justify holding reusable stock; a single short project does not. The arithmetic is in accessories and consumables.
- What the packing unit must be. A stated count per bundle is what makes a return countable. Without it, recovery cannot be reconciled at all.
- What marking is required. Marking is a purchasing requirement that exists to serve the yard, and it costs very little per part. The specification argument is in fastener procurement specification.
None of this is exotic. It is the difference between a yard that knows what it has and a yard that orders again because it cannot tell.